Loading game…
← trends
by Rock Fort Lines · Simulation
| sort | best | latest | drift |
|---|---|---|---|
| top-revisited | 3 | 4 | +1 |
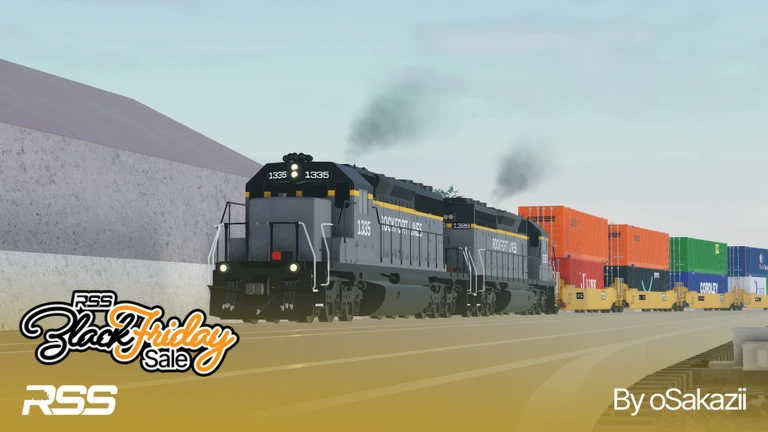
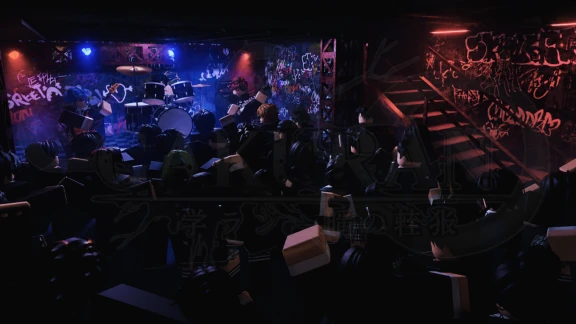
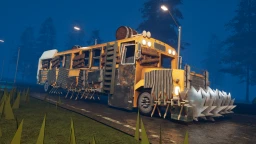
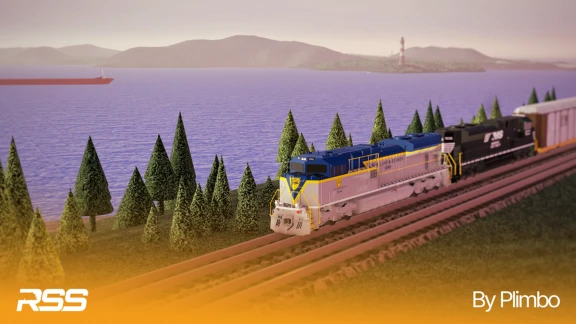
[Originally created January 25, 2020] Welcome to RO-Scale Sandbox! A game where you can build your very own miniature railroad and operate your own trains! There are a variety of trains to operate from around the world, from the obscure, to the world's most famous trains! You can even collaborate with others and build a huge railway with your friends! There is so much you can do in RSS (RO-Scale Sandbox), where the only limit to gameplay is your own imagination, so get creative and have fun with what you create! We hope you enjoy playing and we can’t wait to see you in game! Important Tips: - Don’t give permissions to people you don’t trust! - Always remember to save! - Turn off build collisions! (it will help when building) - Someone says they are a staff member/developer? Real staff have the ability to show their tag in-game
Each vertical bar marks a change to the game's Roblox update date. Taller bars mean more time since the previous recorded update. The height scale compresses long waits so short gaps remain visible. The line behind the bars shows player counts over 90d, so you can see how counts changed around each update.
Dashed lines mark major game launches or player surges during this period ([🎂] Dress To Impress, [WEEK 3 ⛱️] Forsaken, +1 Speed Keyboard Escape | Candy & Chocolate, …). The controls below the chart show or hide these markers.
⚑ markers show Roblox-wide events during this period (Age checks required worldwide, Bot account ban waves begin). These events can affect many games, but a marker does not prove why this game gained or lost players. The controls below the chart show or hide these markers.
The line shows concurrent players (CCU): the number of people in the game at the same time. We record this count about every 30 minutes. We stop collecting new counts after the game stays below 100 concurrent players for a full month.
Each line shows the hourly average player count for this game or a similar-sized Simulation game. We choose competitors with the closest peak player counts during this period. The genre leader, Steal An Egg, peaked at 9,871,643 concurrent players (6,435× this game's peak). It is outside this game's closest competitors, so it has no line here. We use Roblox genre labels and only include games we track.
These are the tracked Simulation games with the highest peak player counts during this period. Each line shows an hourly average. Higher lines mean more concurrent players. This game ranks #554 of 764 among tracked Simulation games, with a peak of 1,534 concurrent players. It is outside this top group. The competitors chart compares it with similar-sized games. Peaks before this period do not affect these rankings.
Each line tracks one of the Simulation games on the Roblox Top Earning list. Values are hourly average ranks. Higher lines mean better ranks, with #1 at the top. Gaps mean we have no listed rank for that time. This game has too little Top Earning history for a line here. In total, 84 tracked Simulation games appeared during this period. This compares earnings ranks. It does not show how much Robux each game earns.
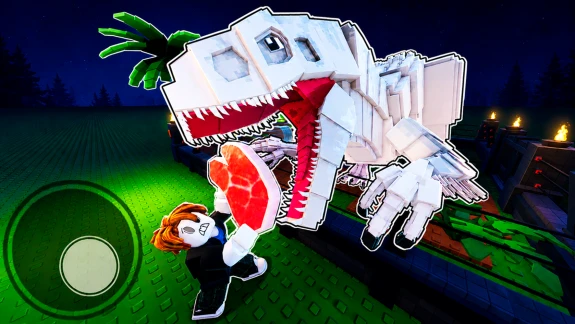
 [COLOSSAL!🦕]Prior Extinction - Dinosaur Survival!2.0× par · avg #802,425 players
 ✨ Creatures of Sonaria 📜 Survive Kaiju Animals1.4× par · avg #2033.8k players
Each dot is a game from the Roblox Top Earning list. Higher dots have better average earnings ranks. Dots farther right have more concurrent players. The dashed par line is a comparison that assumes equal revenue per player across games. Dots to its left reach their rank with fewer players, which suggests stronger monetization per player. Dots to its right suggest weaker monetization per player. This game did not appear on Top Earning. Its average of 674 concurrent players is below the comparison range, which starts at 1,055. Its absence tells us too little about monetization to give it a score. The 84 Simulation games in this comparison have a middle score (median) of 0.58× par. A score of 2× par means half the predicted player count at the same rank. It does not mean twice the revenue or twice as many paying players. We do not have those figures.
| # | game | genre | position | players | vs par |
|---|---|---|---|---|---|
| 1 | [🤑 FIXED DONOS] Donation Central 💸 (BETA) | Social | #16 | 1,042 | 64× |
| 2 | Strikeborn [EARLY ACCESS] | — | #37 | 788 | 28× |
| 3 | Grand Blue [Early Access] | RPG | #11 | 9,467 | 15× |
| 4 | [BOJACK] Gohan 悟飯 | Action | #72 | 469 | 14× |
| 5 | Blade Ball | Action | #11 | 17.1k | 7.5× |
| 6 | [UPDATE ⭐] The Veil | RPG | #25 | 4,716 | 7.4× |
| 7 | [🐢] Bloodlines | RPG · paid access | #53 | 1,582 | 7.3× |
| 8 | [JUNGLE UPDATE] Clover Retribution | RPG | #67 | 1,037 | 7.2× |
[COLOSSAL!🦕]Prior Extinction - Dinosaur Survival!2.0× parRoleplay & Avatar SimThis chart groups the monetization scores above by Roblox genre. Farther right means stronger estimated monetization per player. Each row marks the middle score (median). The shaded range covers the middle 50% of games. This shows how a game compares with others in its genre. Shooter has the highest median at 2.4× par. Survival has the lowest at 0.38× par. This highest/lowest comparison includes genres with at least 3 games. This game did not appear on Top Earning during this period. The 84 Simulation games with enough data have a median of 0.58× par. The middle 50% range from 0.23× to 0.98× par. 3 games without a Roblox genre label are excluded. A score above the median suggests stronger monetization per player than a typical Simulation game in this comparison. These scores do not measure revenue or the percentage of players who pay.
| # | game | position | players | vs par | vs genre |
|---|---|---|---|---|---|
| 1 | SINGLE CABS | Carolina Leaners | #42 | 2,600 | 7.0× | 12× |
| 2 | [🚔COPS] Ghost Driver [ALPHA] | #16 | 16.1k | 4.1× | 7.0× |
| 3 | Idle Mafia Game | #36 | 6,308 | 3.7× | 6.3× |
| 4 | Flip A Boat! | #80 | 1,364 | 3.5× | 6.2× |
| 5 | [ 🪄🎩] Anime Card Clash | #39 | 7,608 | 2.7× | 4.6× |
| 6 | [UPD] Mini War | #19 | 22.5k | 2.3× | 4.0× |
| 7 | Fisch 📜 [JOURNAL] | #10 | 68.4k | 2.2× | 3.9× |
| 8 | [SOUL] Spin a Fem! 🎲 | #83 | 1,896 | 2.1× | 3.7× |
Each line shows this game on a Roblox discovery list, such as Top Playing Now or Top Earning. The line shows its rank, which we record about every 30 minutes. #1 is the best rank. Gaps mean the game left that list or we have no rank data for that time.
The vote lines show the total likes and dislikes at each point in time. Approval is the percentage of all votes that are likes. For example, 90% means 9 out of 10 votes are positive. We record votes about every 30 minutes. Gaps mean we have no vote data for that time.